
Modern IT environments are more complex than ever. From hybrid cloud infrastructure and Kubernetes clusters to serverless apps and distributed microservices, businesses rely on real-time visibility to stay online and competitive.
That’s where server monitoring tools, Application Performance Monitoring (APM) platforms, and observability solutions come in. These tools help DevOps teams, SREs, and IT administrators detect performance bottlenecks, reduce downtime, improve uptime, and deliver exceptional digital experiences.
In this comprehensive guide, you’ll find 30 of the best monitoring and observability tools—including open-source solutions, enterprise-grade platforms, and SaaS-based services—carefully categorized to help you choose the right fit for your infrastructure.
What Are Server Monitoring & Observability Tools?
Before diving in, here’s a quick breakdown:
- Server Monitoring: Tracks CPU, memory, disk usage, uptime, and system health.
- APM (Application Performance Monitoring): Monitors application performance, transactions, errors, and user experience.
- Observability Platforms: Combine logs, metrics, traces, and events to provide deep system insights.
- Log Management Tools: Centralize and analyze logs in real time.
- Network Monitoring Tools: Monitor traffic, latency, packet loss, and infrastructure health.
Leading All-in-One Monitoring & Observability Platforms
1. Better Stack
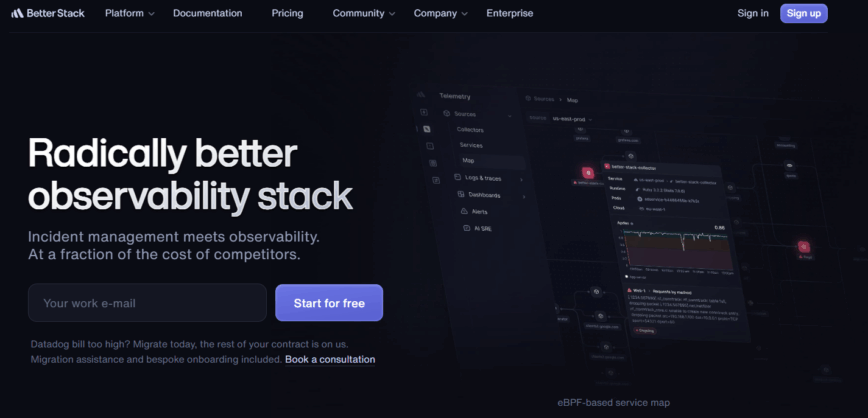
An all-in-one monitoring and incident management platform that unifies logs, metrics, uptime checks, and alerts. Ideal for DevOps teams looking for streamlined on-call workflows and improved uptime.
Pricing: Free plan; paid plans from $29/month.
2. Splunk
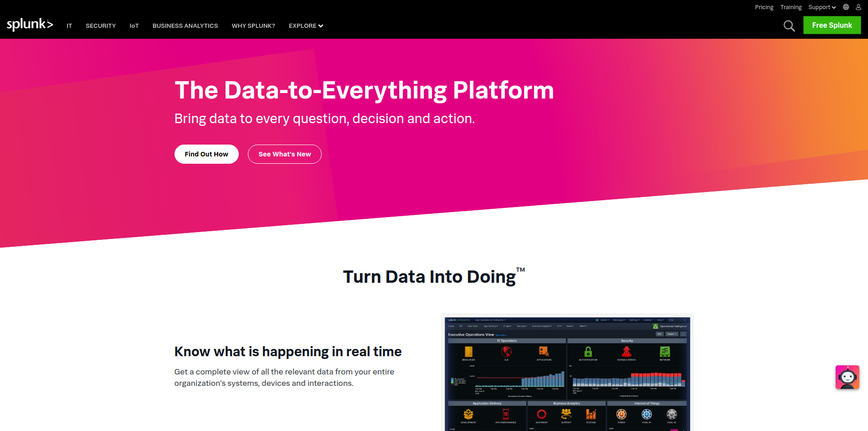
A market leader in machine data analytics, SIEM, AIOps, and log management. Popular among enterprises needing security and operational intelligence.
Pricing: Free tier; paid plans from $75/month.
3. Dynatrace
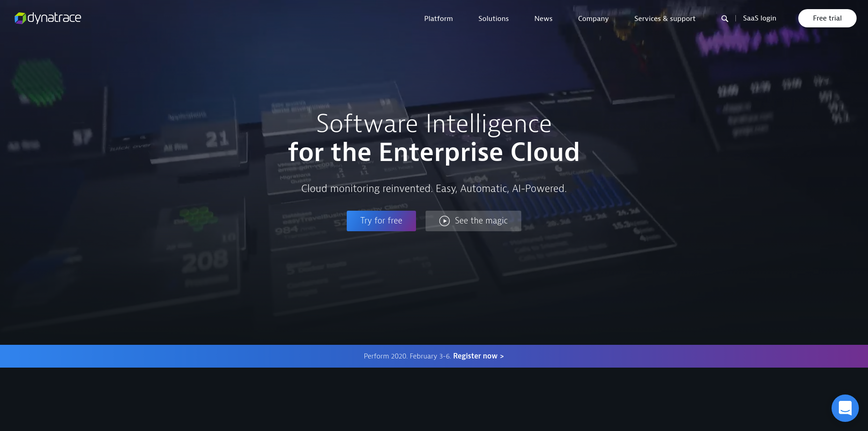
AI-powered APM and observability for enterprise cloud environments. Excellent for automatic discovery and root cause analysis.
Pricing: Free trial; custom pricing.
4. New Relic

A full-stack observability solution offering APM, infrastructure monitoring, and real user monitoring (RUM).
Pricing: Free plan; paid plans from $149/month.
5. Datadog
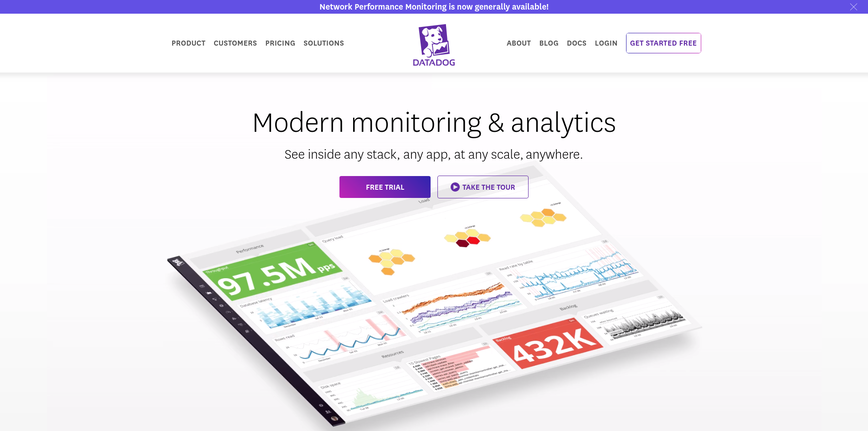
Cloud-scale monitoring, log management, and observability platform for modern DevOps teams.
Pricing: Free tier; usage-based pricing.
6. LogicMonitor
SaaS-based infrastructure monitoring for networks, servers, and cloud environments.
Pricing: Free trial; from $249/month.
7. SolarWinds
Well-known for server monitoring, APM, and network performance tools trusted by IT professionals worldwide.
Pricing: 30-day trial; custom pricing.
Open-Source Monitoring & Observability Tools
If you’re looking for flexibility and cost control, open-source monitoring tools are powerful alternatives.
8. Zabbix
Enterprise-grade open-source monitoring for servers, networks, and applications. Highly scalable.
Pricing: Free.
9. Prometheus

Time-series monitoring system widely used in Kubernetes environments.
Pricing: Free open-source.
10. Grafana
Popular visualization platform for metrics, logs, and time-series data. Integrates with Prometheus and many others.
Pricing: Free open-source; enterprise version available.
11. Nagios
One of the oldest and most trusted network and server monitoring solutions.
Pricing: Open-source version free.
12. Icinga
Fork of Nagios with improved scalability and automation features.
Pricing: Free open-source.
13. OpenNMS
Enterprise-grade distributed network monitoring platform.
Pricing: Free open-source.
14. Monit

Lightweight Unix monitoring tool for automatic maintenance and recovery.
Pricing: Free.
15. Munin

Plug-and-play resource monitoring with automated graph generation.
Pricing: Free.
Cloud & DevOps-Focused Monitoring Tools
16. Amazon CloudWatch
Comprehensive monitoring service for AWS infrastructure and applications.
Pricing: Free tier; usage-based.
17. Microsoft Azure Monitor

Advanced monitoring and telemetry for Azure environments.
Pricing: Pay-as-you-go.
18. Sysdig
Container and Kubernetes monitoring with security insights.
Pricing: Free trial; from $25/month.
19. Lumigo
Serverless observability with automated tracing and anomaly detection.
Pricing: Free trial; custom plans.
20. Instana
Automated APM designed for cloud-native and microservices architectures.
Pricing: Free trial; from $11/month.
Website Uptime & Performance Monitoring
21. Pingdom
Monitors website uptime and performance from global locations.
Pricing: From $14.95/month.
22. UptimeRobot
Simple and affordable uptime monitoring with email/SMS alerts.
Pricing: Free up to 50 monitors.
23. StatusCake
Website uptime, page speed, and domain monitoring.
Pricing: Free tier; paid from $24.49/month.
24. Uptime.com
Enterprise-grade website and API monitoring.
Pricing: From $10/month.
Log Management & Error Tracking Tools
25. Sentry
Real-time error tracking and exception monitoring for web and mobile apps.
Pricing: Free plan; from $26/month.
26. Rollbar
Error monitoring and debugging tool supporting multiple languages.
Pricing: Free tier; from $49/month.
27. Sumo Logic
Cloud-native log analytics and SIEM platform.
Pricing: Free up to 500MB/day.
28. Papertrail
Cloud-based log aggregation and real-time search.
Pricing: From $5/month.
AI & Advanced Analytics Monitoring
29. Zenoss

Hybrid IT monitoring with AI-driven analytics and root cause detection.
30. Harness SLO
Automated root cause analysis and service reliability management.
Lightweight & Niche Monitoring Tools
- Glances – Cross-platform CLI monitoring.
- Monitorix – Lightweight Linux server monitoring.
- Supervisord – Process monitoring and control.
- Graphite – Time-series data graphing.
- ntop – Network traffic analysis.
How to Choose the Right Monitoring Tool
When selecting a server monitoring or APM solution, consider:
- Infrastructure size (startup vs enterprise)
- Cloud-native vs on-premise deployment
- Kubernetes/container support
- Budget and pricing model
- Alerting and incident response features
- Log + metrics + tracing integration
- Compliance and security requirements
For small businesses, tools like UptimeRobot, Zabbix, and Prometheus provide excellent value.
For large enterprises, Dynatrace, Splunk, Datadog, or New Relic deliver advanced automation and AI-driven insights.
Conclusion
In today’s cloud-first world, downtime equals lost revenue. Investing in the right server monitoring, APM, and observability tools can dramatically reduce outages, improve system reliability, and enhance user experience.
Whether you’re running a small website, managing enterprise IT infrastructure, or operating a global SaaS platform, the tools above provide the visibility and control you need to stay ahead.
Choose wisely, test thoroughly, and build a monitoring stack that scales with your business.
And if you'd like to go a step further in supporting us, you can treat us to a virtual coffee ☕️. Thank you for your support ❤️!

We do not support or promote any form of piracy, copyright infringement, or illegal use of software, video content, or digital resources.
Any mention of third-party sites, tools, or platforms is purely for informational purposes. It is the responsibility of each reader to comply with the laws in their country, as well as the terms of use of the services mentioned.
We strongly encourage the use of legal, open-source, or official solutions in a responsible manner.
Comments